Varnish command line tools
Varnish comes with several very useful command line tools that can be a bit hard to get the grasp of. The list below is by no means meant to be exhaustive, but give an introduction to some tools and use cases.
varnishhist
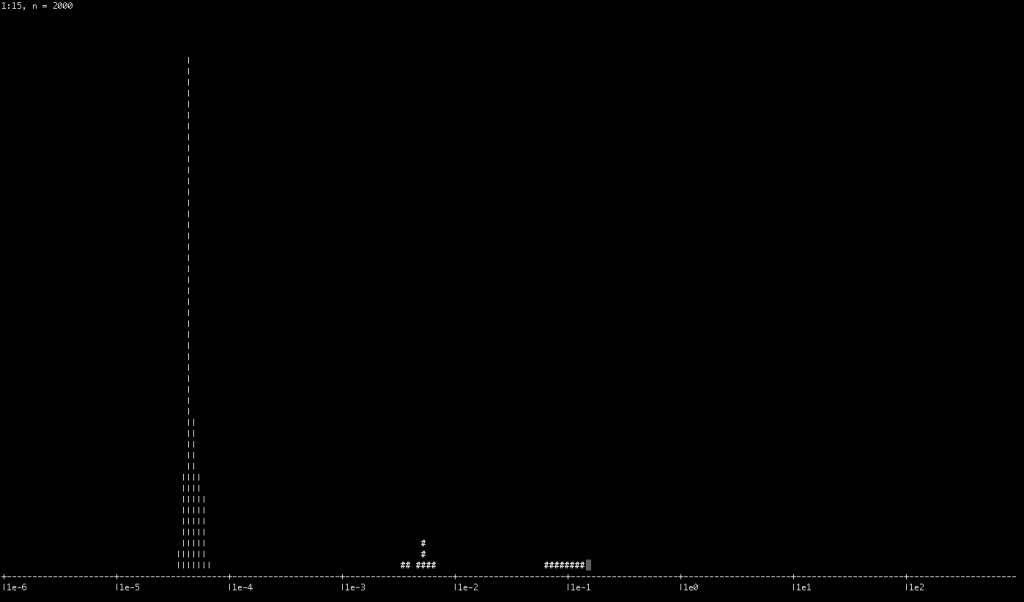
Easily seen as a geeky graph with little information, varnishhist is actually extremely useful to get an overview of the overall status of your backend servers and varnish.

The pipes (|) are requests served from the cache whereas the hash-signs (#) are requests to the backend. The X axis is a logaritmic scale for request times. So the histogram above shows that we have a good amount of cache hits that are served really fast whereas roughly half of the backend requests takes a bit more than 0,1s. Like most of the other command line applications you can filter out the data you need with regex, only show backend requests or only cache hits. See https://www.varnish-cache.org/docs/trunk/reference/varnishhist.html for a complete list of parameters.
varnishstat
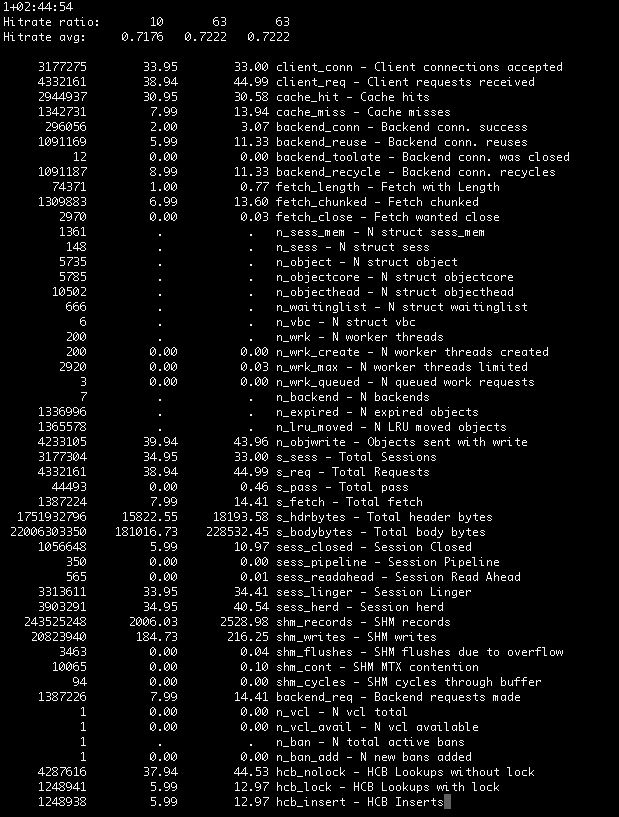
varnishstat can be used in two modes, equally useful. If run with only "varnishstat" you will get a continously updated list of the counters that fit on your screen. If you want all the values for indepth analysis you can however use "varnishstat -1" for the current counter values.
Now a couple of important figures from this image:
- The very first row is the uptime of varnish. This instance had been restarted 1 day and 2h 44 mins before screenshot
- The counters below that are the average hitrate of varnish. The first row is the timeframe and the second is the average hitrate. If varnishstat is kept open for longer the second timeframe will go up to 100 seconds and the third to 1000 seconds
- As for the list of variables below the values correspons to total value, followed by current value and finally the average value. Some rows that are apparently interesting would be
- cache_hit/cache_miss to see if you have monumental miss storms
- Relationship between client_conn and client_req to see if connections are being reused. In this case there's only API traffic where very few connections are kept open. So the almost 1:1 ratio is to be seen as normal.
- Also relationship between s_hdrbytes and s_bodybytes is rather interesting as you can see how much of your bandwith is actually being used by the headers. So if s_hdrbytes are a high percentage of your s_bodybytes you might want to consider if all your headers are actually necesary and useful.
varnishtop
Varnishtop is a very handy tool to get filtered information about your traffic. Especially since alot of high-traffic varnish sites do not have access_logs on their backend servers - this can be of great use.
tx are always requests to backends, whereas rx are requests from clients to varnish. The examples below should clarify what I mean.
Some handy examples to work from:
See what requests are most common to the backend servers.
varnishtop -i txurl
See what useragents are the most common from the clients
varnishtop -i RxHeader -C -I ^User-Agent
See what user agents are commonly accessing the backend servers, compare to the previous one to find clients that are commonly causing misses.
varnishtop -i TxHeader -C -I ^User-Agent
See what cookies values are the most commonly sent to varnish.
varnishtop -i RxHeader -I Cookie
See what hosts are being accessed through varnish. Will of course only give you useful information if there are several hosts behind your varnish instance.
varnishtop -i RxHeader -I '^Host:'
See what accept-charsets are used by clients
varnishtop -i RxHeader -I '^Accept-Charset'
varnishlog
varnishlog is yet another powerful tool to log the requests you want to analyze. It's also very useful without parameters to develop your vcl and see the exact results of your changes in all it's verbosity. See https://www.varnish-cache.org/docs/trunk/tutorial/logging.html for the manual and a few examples. You will find it very similar to varnishstop in it's syntax.
One useful example for listing all details about requests resulting in a 500 status:
varnishlog -b -m "RxStatus:500"
varnishncsa
varnishncsa is a handy tool for producing apache/ncsa formatted logs. This is very useful if you want to log the requests to varnish and analyze them with one of the many availalable log analyzers that reads such logs, for instance awstats.
